Case Study

Batanghari Basin
Mining Impact Monitoring

Attributing rising sediment loads to their sources — tributary by tributary, across two sub-basins — using nine years of satellite data.

This project was delivered by Philipp Grötsch as an individual contractor to an international development bank.

Sumatra, Indonesia Batanghari & Tebo & Tembesi Basins Suspended Matter · CDOM · Chlorophyll-a 2016 – 2025
9 yearsSatellite archive
10Confluence sites
~3 %/yrSediment increase at Batang Hari
The Goal

Expanding mining is loading a river — prove it with data.

The Batang Hari and its tributaries drain a large swath of Sumatra's interior, supporting riparian communities, fisheries, and downstream water users across the province of Jambi. Over the past decade, satellite imagery and local measurements have shown worsening water clarity throughout the basin — mining is widely regarded as a primary culprit, yet a direct link was difficult to establish without comprehensive data.

This study used nine years of Sentinel-2 satellite imagery to track suspended matter concentrations at ten strategic confluence sites across the Tebo and Tembesi sub-basins — where mining-affected tributaries join larger rivers. The goal: attribute increasing sediment loads to specific upstream sources and quantify how fast those loads are growing.

Beyond visible sediment, the findings carry implications for heavy metal contamination — mercury, lead, arsenic, and other mining-associated pollutants that travel the same pathways and accumulate in aquatic food webs relied upon by local communities.

Project Overview

📡
Satellite coverage ESA Sentinel-2 · 10 m resolution · full basin extent
📍
Confluence sites 10 sites — 7 in Tembesi basin, 3 in Tebo basin — selected for known or suspected mining activity
💧
Parameters tracked Suspended Matter (SPM), CDOM, Chlorophyll-a, Apparent Visible Wavelength (AVW)
📊
Analysis methods Mann-Kendall trend test · STL seasonal decomposition · Tributary & Dilution Index
📅
Study period 2016 – 2025 (Sentinel 2 archive)
The Challenge

Mining is spreading across remote headwaters. Proving cause and effect — at basin scale, over years — requires a more than localized grab sampling.

Batang Hari watershed with ranked tributaries — thick lines indicate higher-order rivers, thin lines smaller tributaries, illustrating the scale and complexity of the basin monitoring challenge

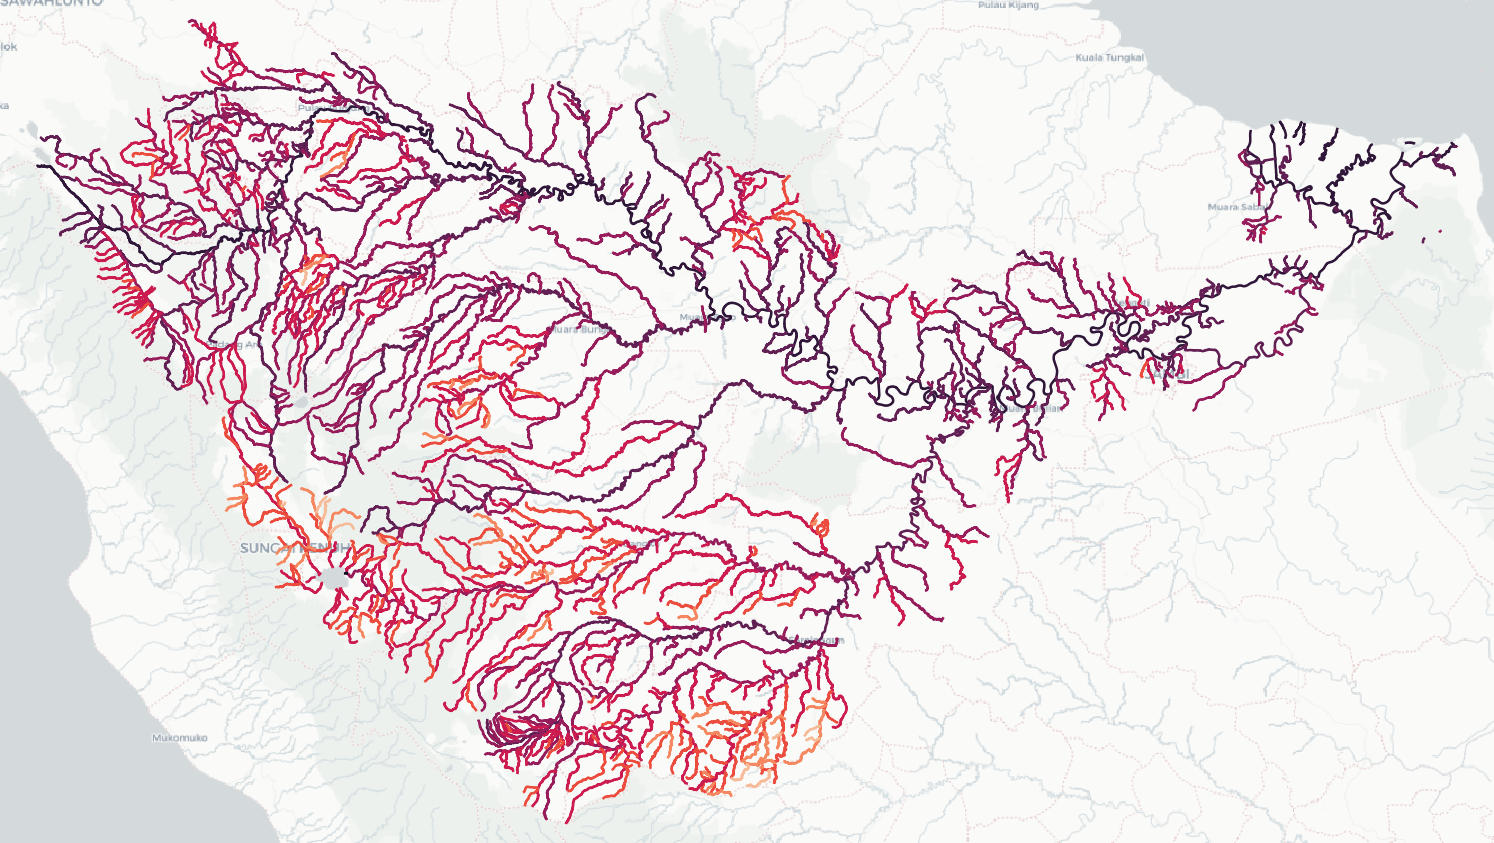
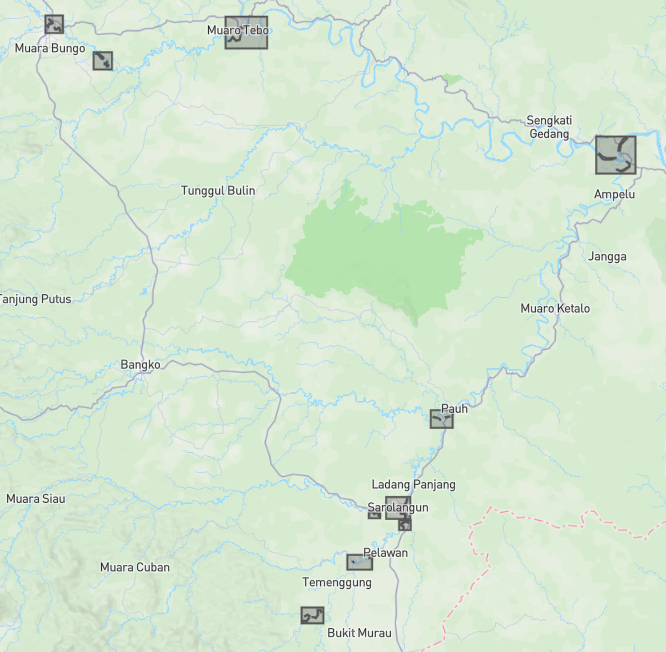
Batang Hari watershed with ranked tributaries. The monitoring challenge spans hundreds of waterways across a remote, cloud-prone equatorial basin.

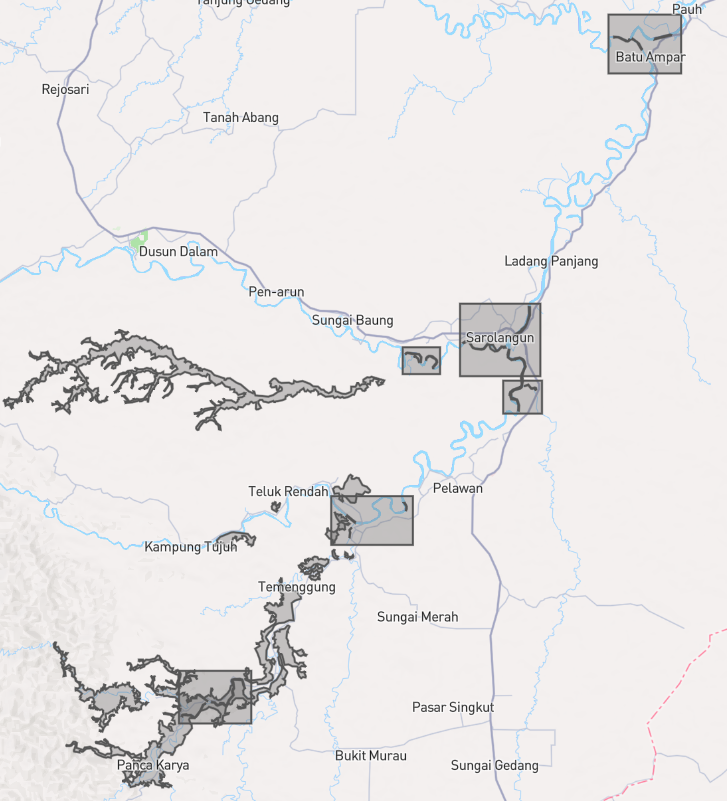
Remote, inaccessible terrain

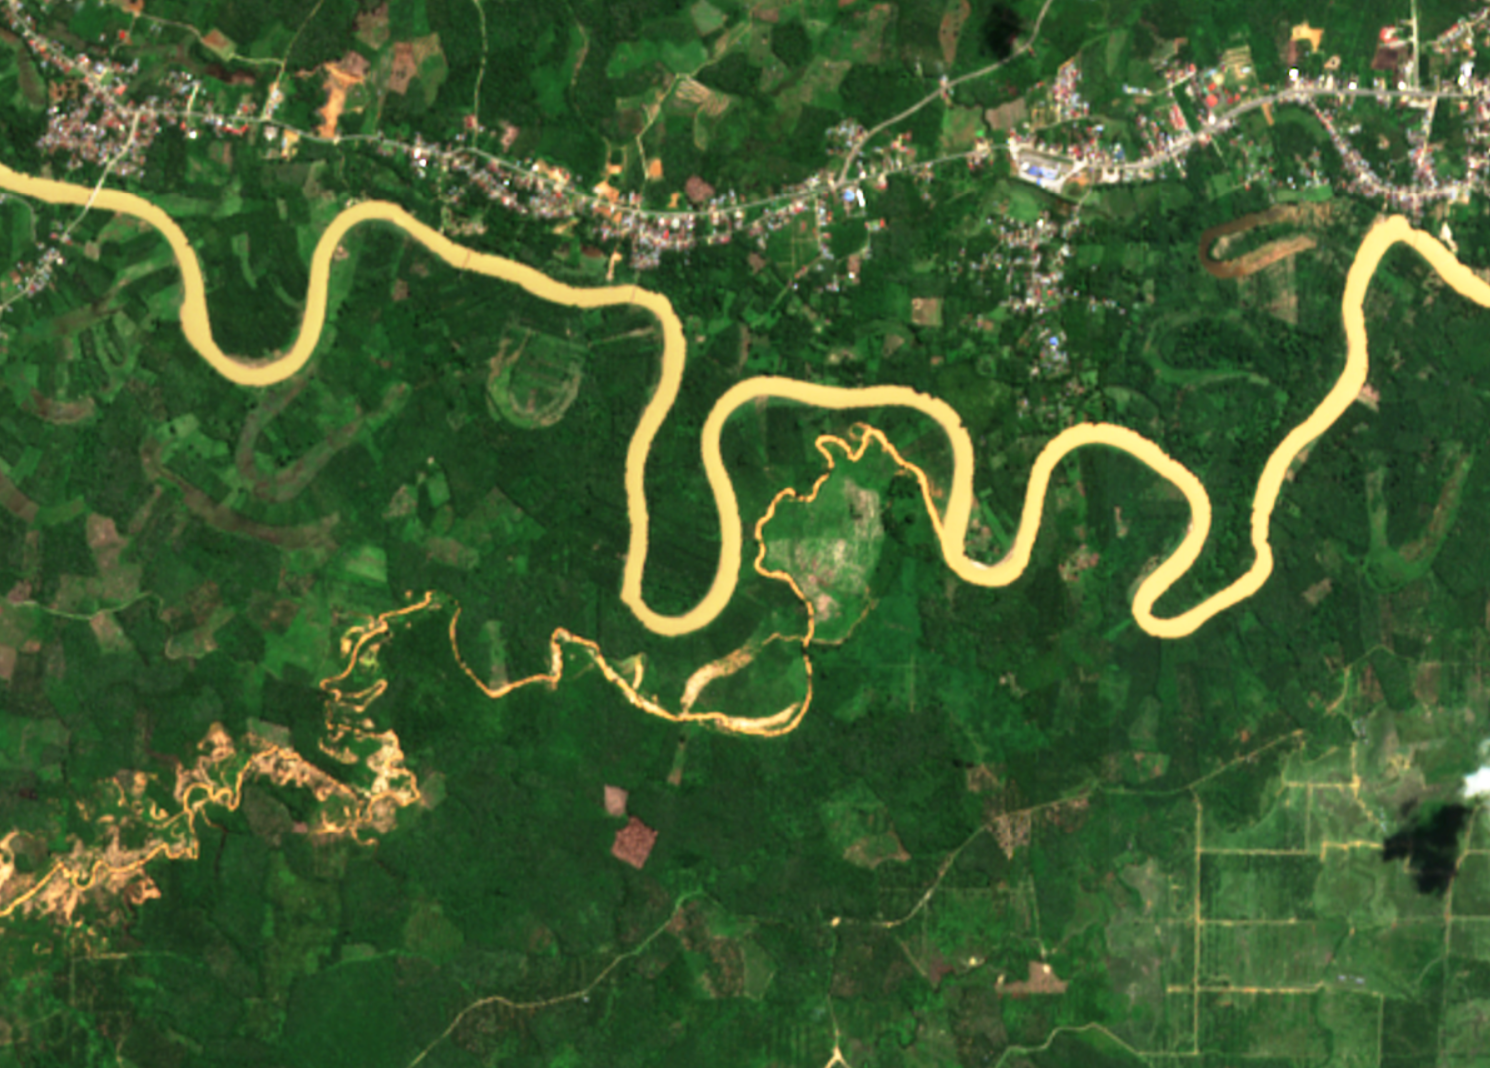
Mining activities occur deep in Sumatra's interior — areas where physical sampling is logistically difficult, expensive, and provides only isolated snapshots in time. A basin-wide picture requires a different approach.

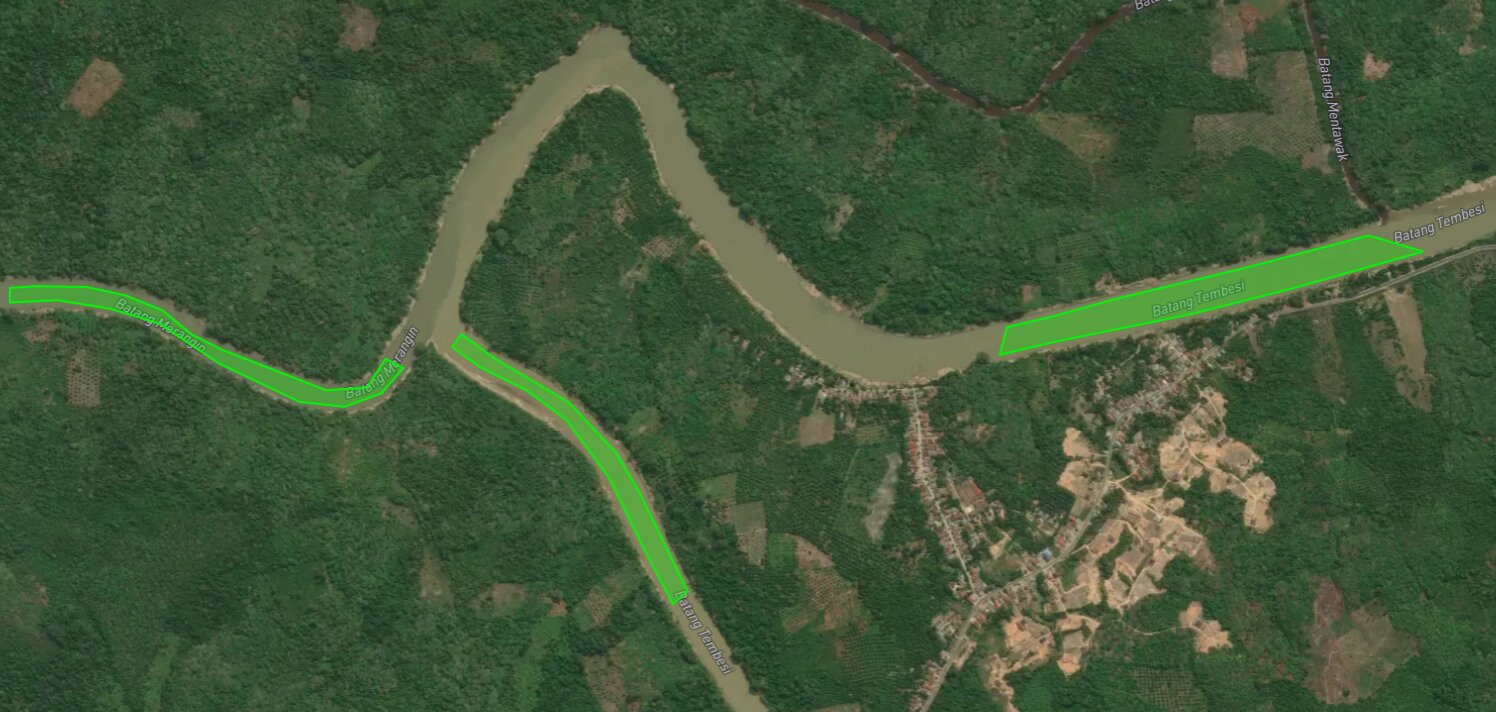
Small tributaries below sensor resolution

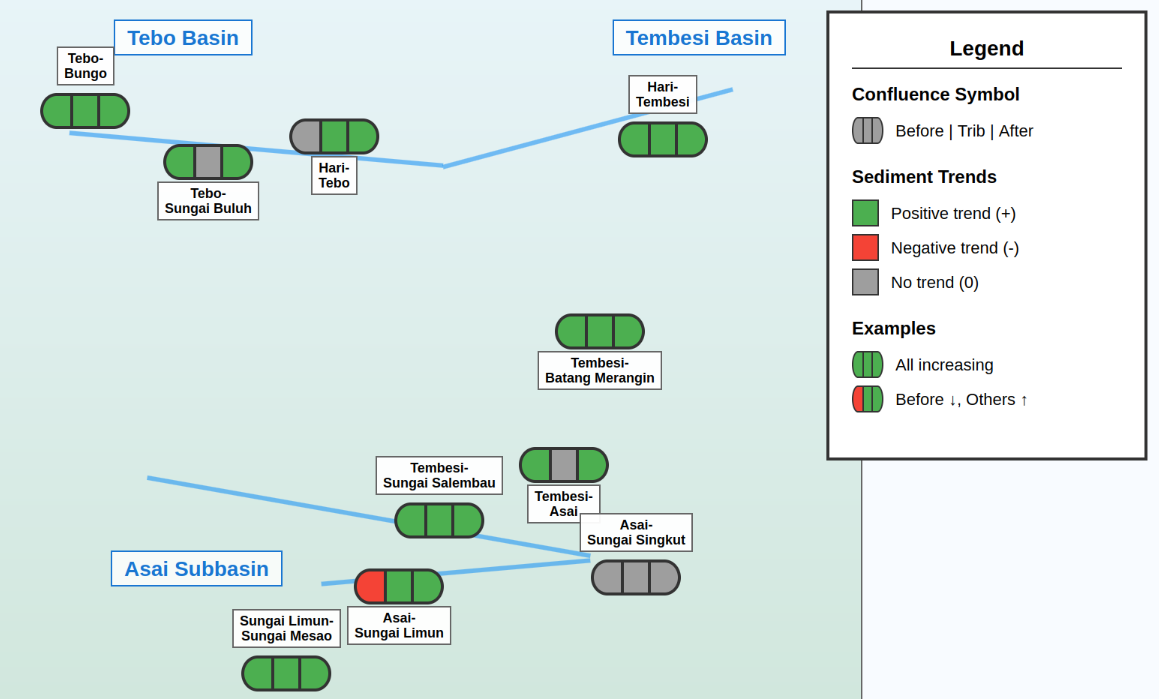
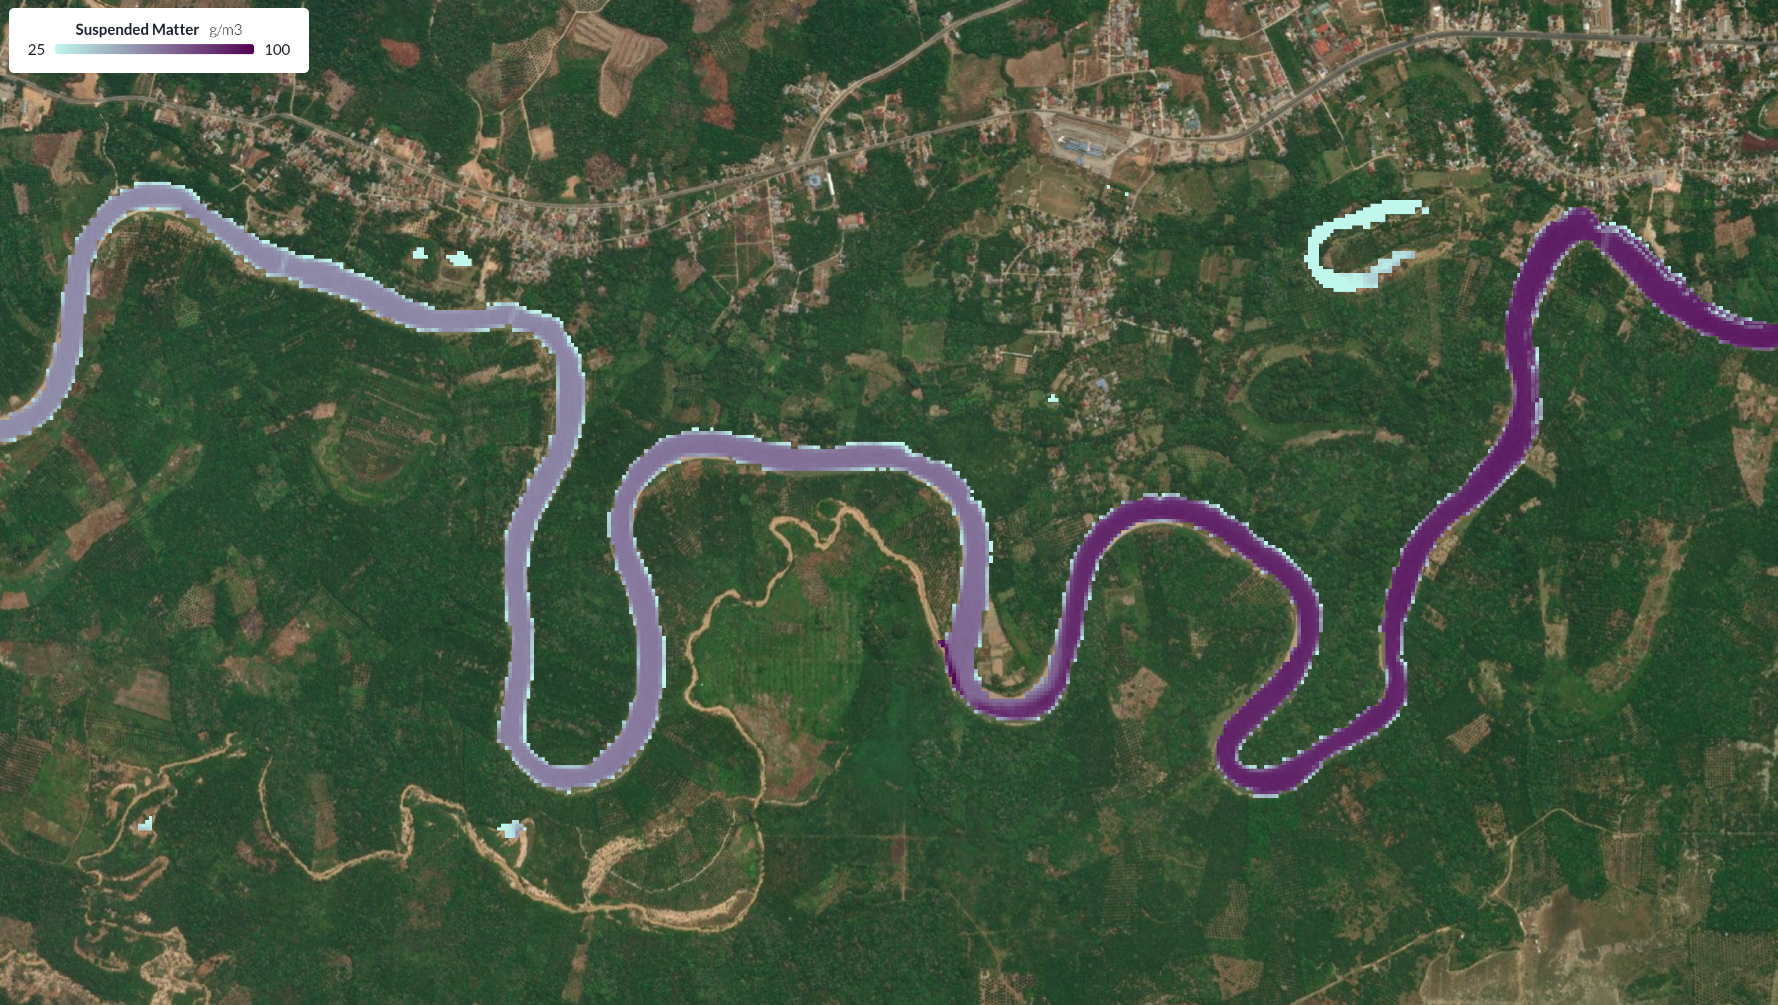
Some of the most impacted waterways are too narrow to resolve with 10 m satellite imagery. Their influence must be inferred from concentration changes in the main river immediately downstream of their confluence.

Separating mining from natural drivers

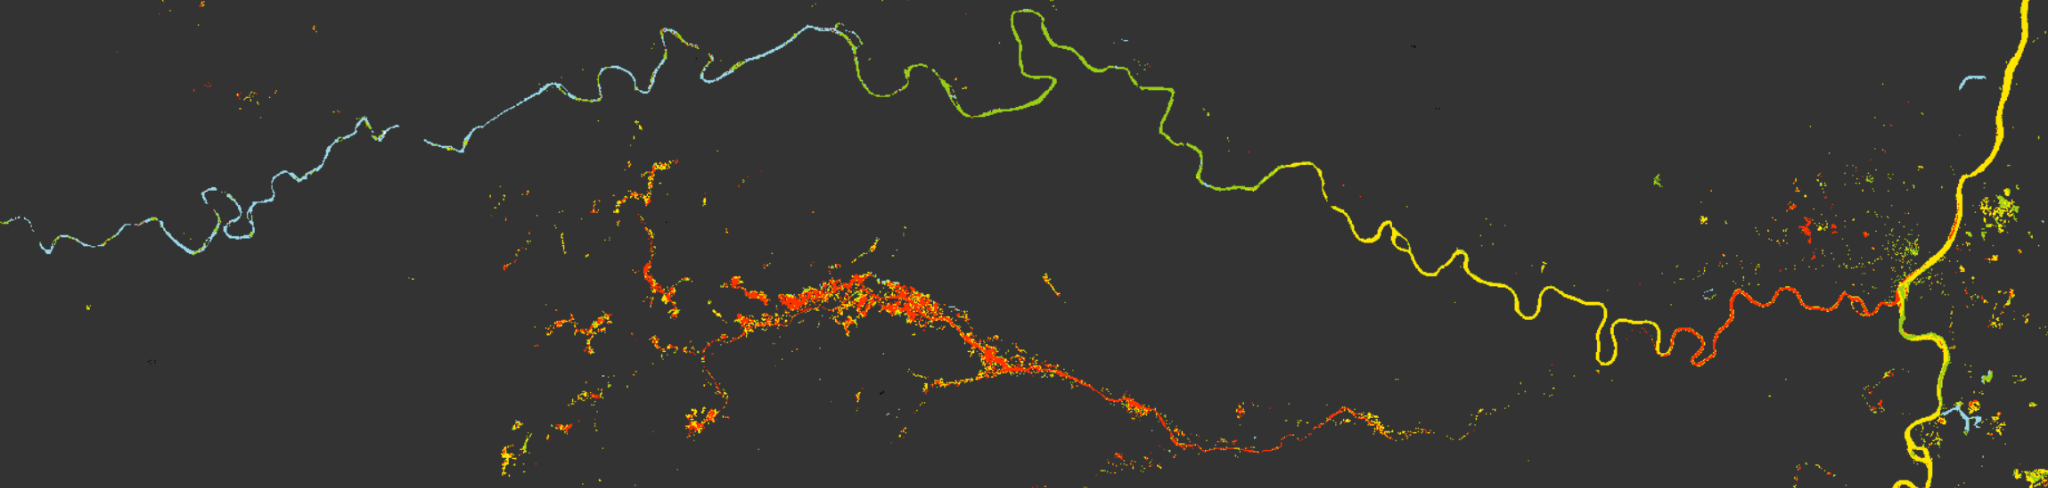
Rainfall events, seasonal flooding, land-use conversion, and peat drainage all affect sediment loads independently of mining. Distinguishing anthropogenic from natural sources requires multi-year trend analysis, not single-event observation.

Cloud cover during peak events

Tropical cloud cover is highest during rainy season — precisely when sediment transport is most intense. Single-date analysis is unreliable; only long-term statistical aggregation yields robust results.

No flow data to quantify total load

River discharge is largely unknown across this basin, making mass-balance calculations impossible with conventional methods. The analysis instead focuses on concentration distributions and relative indices — metrics that are informative even without volumetric flow data.

Only continuous, satellite-derived observations across the full basin — spanning multiple years and covering every major confluence — could reveal the spatial fingerprint of mining-related sediment.
Map showing all ten locations of interest (confluence monitoring sites) across the Tebo and Tembesi basins in Sumatra
Our Approach

Nine years of satellite data — processed across major confluences.

The full Sentinel-2 archive from 2016 onward was ingested, atmospherically corrected, and processed to water quality parameters across the entire basin extent. At each of ten strategic confluence sites, three sampling zones were defined: the main river upstream of the confluence, the tributary, and the main river downstream — allowing the sediment contribution of each tributary to be directly quantified.

Seasonal variability was separated from long-term trends using STL decomposition and Mann-Kendall trend tests. This combination distinguishes mining-driven increases from natural annual cycles — and identifies where sediment loads are accelerating fastest.

Three layers of analysis.

Sentinel-2 derived suspended matter map of the Batang Tembesi basin showing sediment concentrations across the full river network
Layer 1

Nine-year basin-wide archive

Every available Sentinel-2 scene from 2016 to 2025 was processed to suspended matter concentrations across the full river network — establishing seasonal baselines and capturing multi-year trends that short-term sampling programs cannot reveal.

Diagram illustrating the confluence analysis method — three sampling zones defined at the junction of a main river and tributary for before/tributary/after suspended matter comparison
Layer 2

Confluence attribution analysis

At each of the ten confluence sites, Tributary and Dilution Indices quantify how much sediment each mining-affected tributary contributes to the main river — and whether that contribution is growing over time. The method works even for tributaries too small to resolve directly.

Schematic map of the Tebo and Tembesi basins showing the direction and magnitude of sediment concentration trends at all ten analyzed confluences
Layer 3

Basin-wide trend mapping

Mann-Kendall trend tests and STL seasonal decomposition were applied to every location of interest — producing a spatial map of where sediment loads are rising, at what rate, and how far upstream the signal can be traced.

Results

A clear chain of attribution — source to mouth.

At nine of the ten confluence sites analyzed, tributaries draining active mining areas contribute elevated sediment loads to the main river — and at most sites, those loads are increasing year over year. The signal strengthens as you move upstream toward the source.

The attribution chain is unambiguous in the Tembesi basin: Sungai Mesao feeds Sungai Limun, which feeds the Batang Asai, which feeds the Tembesi, which feeds the Batang Hari. At each step, the dilution index confirms the upstream tributary as the dominant sediment source. The Rantaugadang mining area — draining via Sungai Salembau — is a particularly clear example: a concentration jump visible in the satellite data from 2019–2020 onward, with rates of increase accelerating since.

These trends are corroborated by independent turbidity measurements from BWS Sumatera VI (the regional water authority), which show the same multi-year increase in the Batang Hari and Tembesi.

~3 %/yr
Sediment increase at Batang Hari – Tembesi confluence
Corroborated by BWS Sumatera VI turbidity data · Trend since 2016
4.8 %/yr
Fastest-increasing tributary — Tebo / Sungai Buluh
Mining drainage visible from satellite · Bingo Airport mining area upstream
Suspended matter concentration map of the Sungai Salembau entering the Batang Tembesi — mining-sourced sediment plume clearly visible despite the tributary's small size
Attribution in Action

Invisible to the eye. Unmistakable from space.

The Sungai Salembau is a tiny tributary draining the Rantaugadang mining area into the Batang Tembesi. In a true-color satellite image, the confluence is barely visible. In suspended matter concentration derived from the same image, the mining-sourced sediment plume stands out clearly — and its increasing trend over time makes the attribution unambiguous.

True-color (RGB) satellite view of the Sungai Salembau entering the Batang Tembesi — the color difference at the confluence is subtle and easy to miss
Suspended matter concentration map of the same Sungai Salembau confluence — the mining-sourced sediment plume is clearly visible as a high-SPM intrusion into the Tembesi

Left: true-color (RGB) view. Right: satellite-derived suspended matter concentration. Same scene, same satellite — processed differently. The impact of this small mining tributary is nearly invisible in RGB and unambiguous in SPM.

"The research demonstrated a clear attribution of increasing sediment loads to mining operations throughout the watershed. Our methodology proved effective for trend analysis despite challenges like cloud cover and spatial resolution limitations."

Dr. Philipp Grötsch — Aqualytics

Let's get to work

Is mining affecting your watershed?

The approach used in the Batanghari study — long-term satellite trend analysis, confluence attribution, and spatial fingerprinting of pollution sources — is deployable anywhere in the world with Sentinel-2 coverage. No sensors required for an initial assessment. We work with environmental agencies, conservation organizations, and development institutions to turn satellite archives into evidence.

Find out how our solutions can work for you.

Whether you're monitoring a single watershed or building a basin-wide evidence base, we can help.

Get in touch
Satellite-derived suspended matter gradient map of the Batang Tembesi river system — color scale from blue (low concentration) to red (high concentration) revealing the spatial pattern of mining-sourced sediment across the full basin