Case Study

Klamath River
Dam Removal Monitoring

Tracking sediment, algae, and river recovery across 408 km — from the world's largest dam removal to the Pacific Ocean.

This project was delivered by Gybe to a large restauration company. Gybe's know-how and science team now operate as Aqualytics.

Northern California / Southern Oregon 408 km Turbidity · Suspended Matter · Chlorophyll-a 2022 – 2025
2,377 km²Satellite coverage
1.5 TBImagery collected
55,663Sensor measurements
The Goal

A river reclaimed — and the data to prove it.

Four hydroelectric dams built between 1911 and 1962 had blocked salmon spawning grounds for over a century and caused chronic toxic algal blooms in their reservoirs. Following decades of advocacy by the Yurok and Karuk tribes, all four dams — J.C. Boyle, Copco No. 1, Copco No. 2, and Iron Gate — were breached in 2024 in the largest dam removal in history.

RES (Resource Environmental Solutions) needed to monitor the ecological consequences: the massive sediment loads released from behind the dams, the downstream propagation of turbidity slugs, and the longer-term recovery of water quality across the full lower basin — from the former Copco reservoir in California all the way to the Pacific Ocean.

Monitoring had to begin before drawdown to establish a meaningful baseline, and continue through stabilization to document river recovery. The Klamath is also culturally significant — healthy salmon runs are central to the way of life of the Yurok and Karuk peoples who led the restoration effort.

Project Overview

📡
Satellite coverage ESA Sentinel-2 (2016–2025) · Planet SuperDove (July 2023–2025) · 2,377 km²
🔬
Sensors 4 hyperspectral sensors — Iron Gate, Seiad Valley, Walker Bridge, Requa
💧
Parameters tracked Turbidity, Suspended Matter, Chlorophyll-a, Cyanobacteria Index, CDOM
📅
Project Duration October 2022 – November 2025
🌊
Coverage extent Full lower Klamath basin + Pacific Ocean sediment plume monitoring
The Challenge

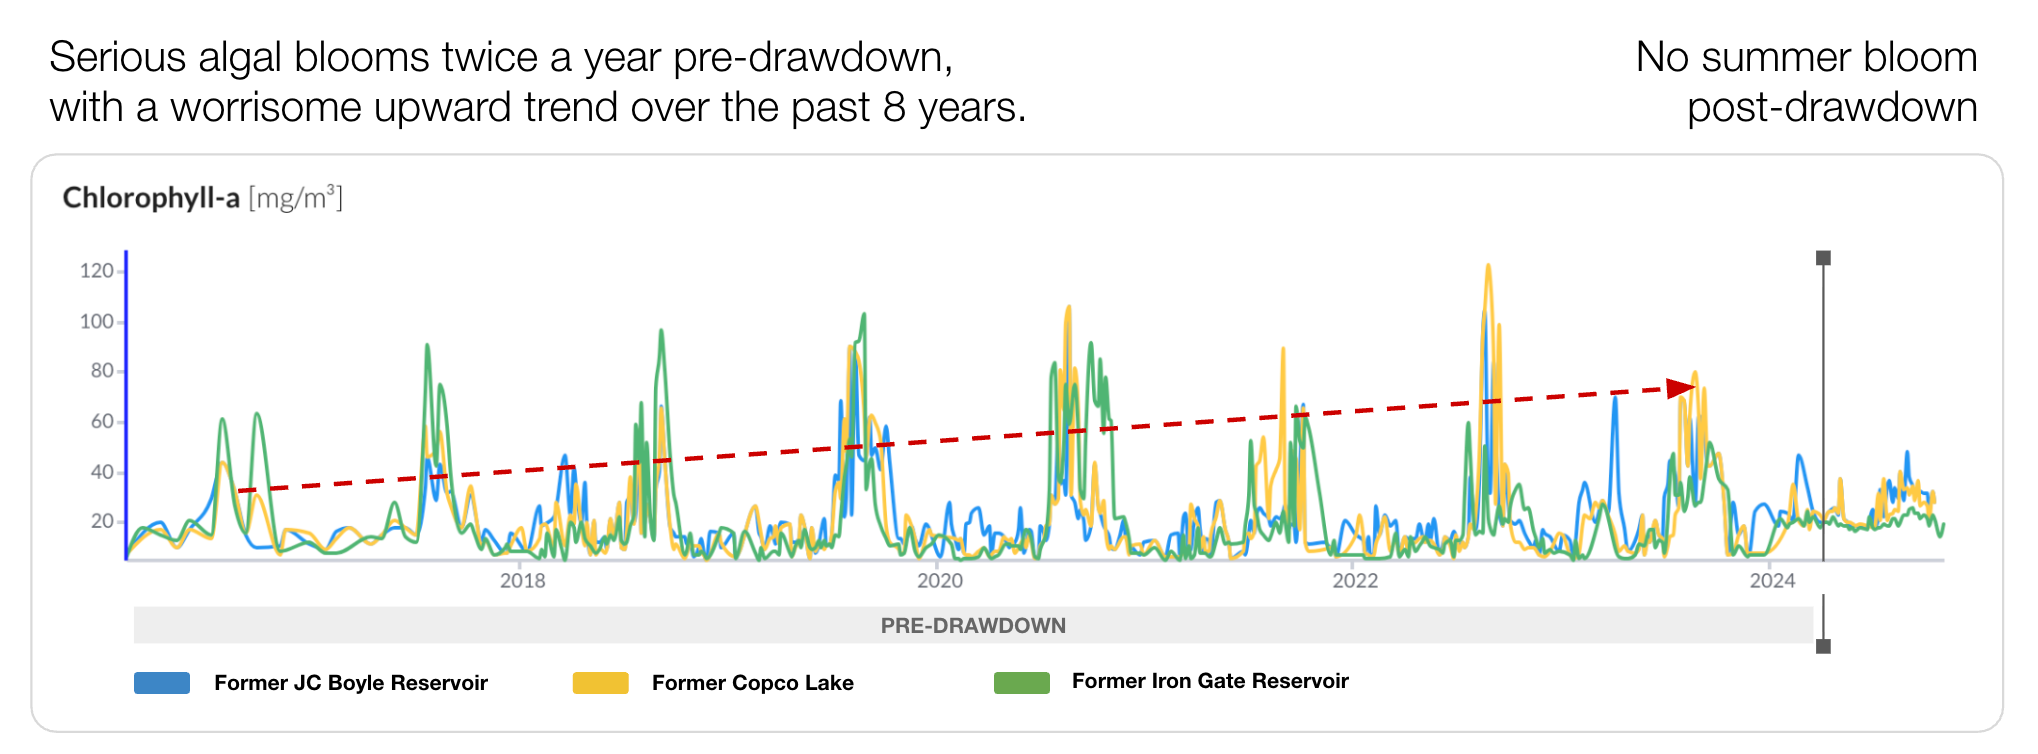
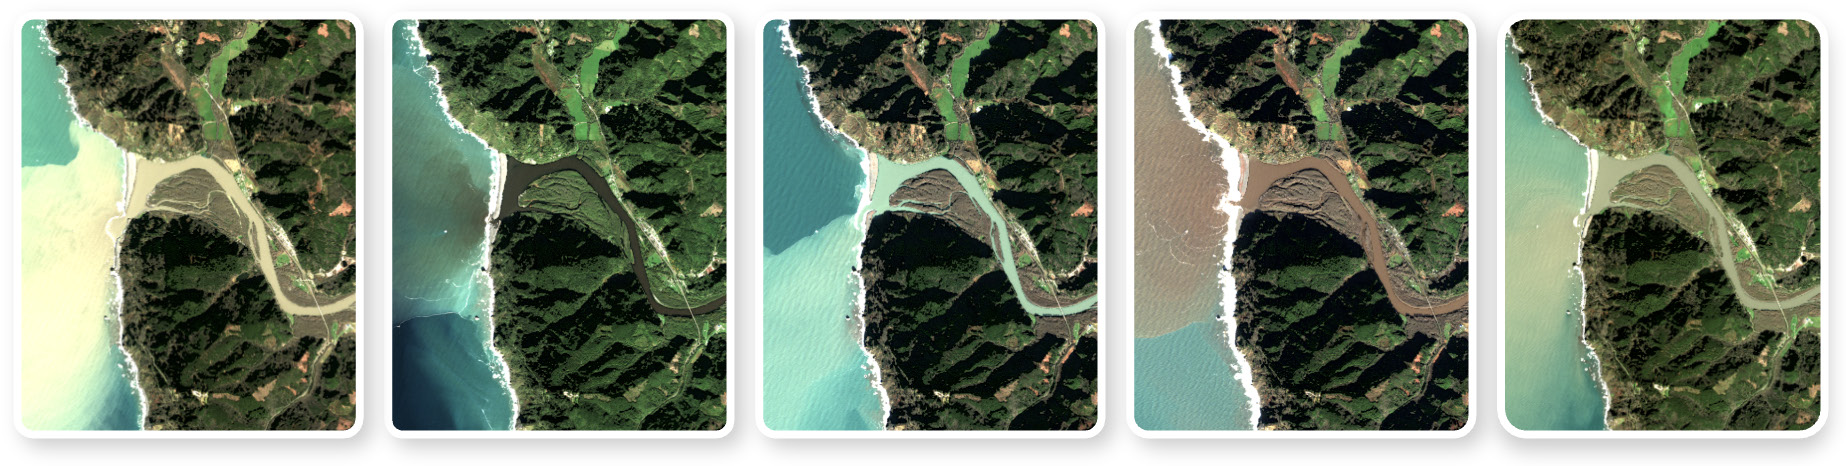
The dam breaches released decades of accumulated sediment in a matter of days. Standard monitoring tools weren't built for this.

Sentinel-2 imagery of Iron Gate Reservoir before, during, and after dam removal — reservoir water replaced by exposed sediment and free-flowing river channel

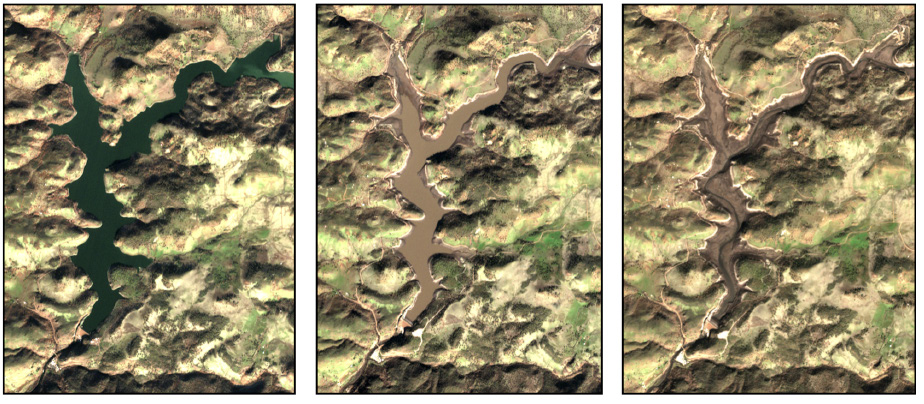
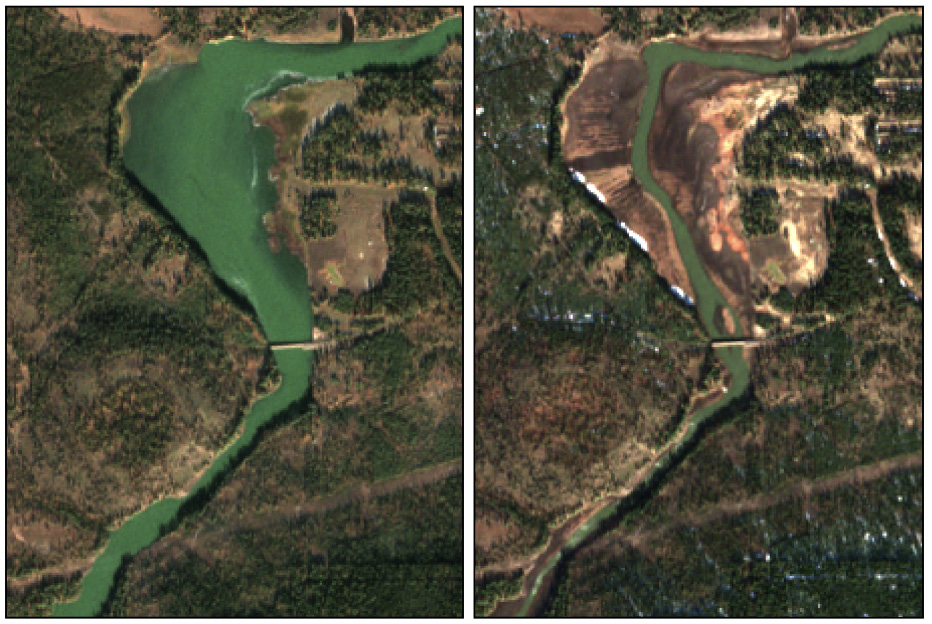
Iron Gate — before, during, after. Sentinel-2 imagery: reservoir pre-removal (Dec 2023), peak sediment release (Feb 2024), free-flowing river (Feb 2025).

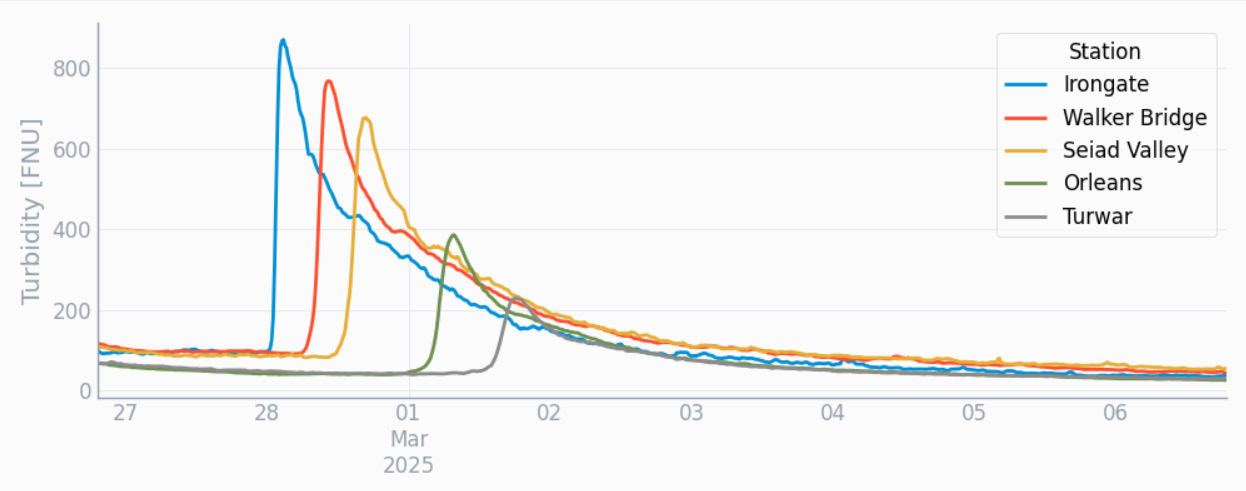
Sediment loads beyond normal ranges

Post-removal turbidity spikes exceeded the detection limits of standard remote sensing algorithms — reaching over 1,400 FNU. Accurately measuring these extreme events required custom approaches developed specifically for the Klamath.

Highly variable water conditions

Snowmelt runoff, organic matter flushes, and storm runoff each produce distinct water types with different optical signatures. Meaningful comparison across seasons and events requires distinguishing these conditions from one another.

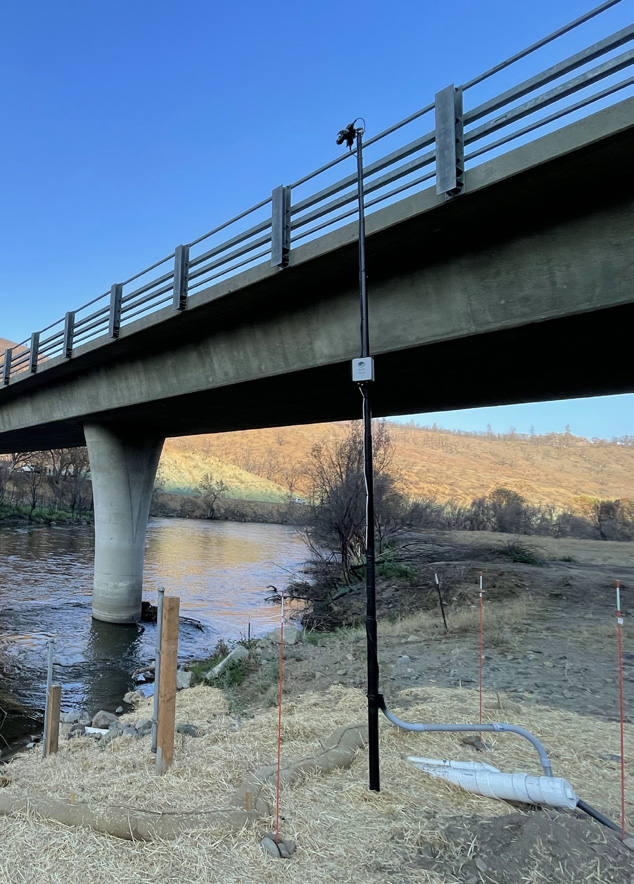
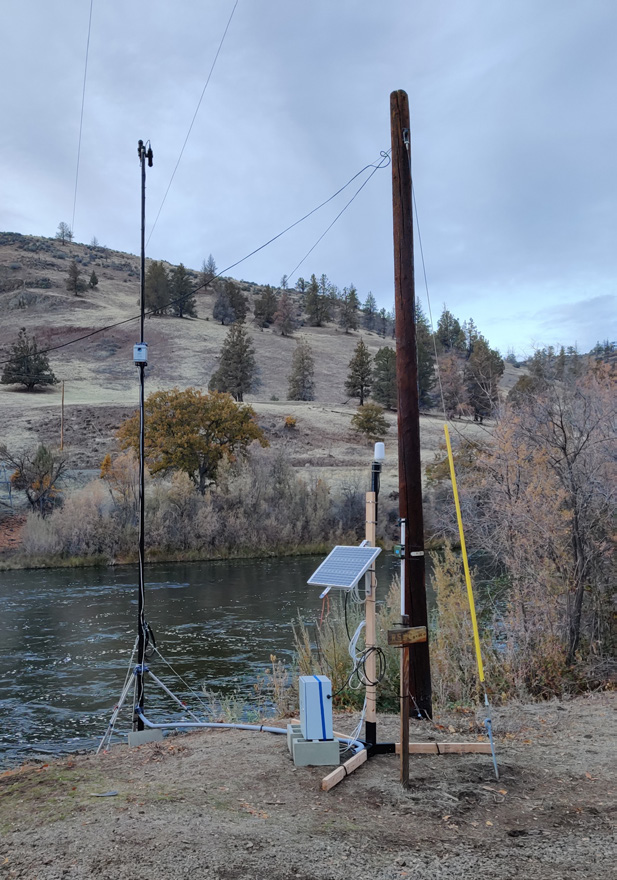
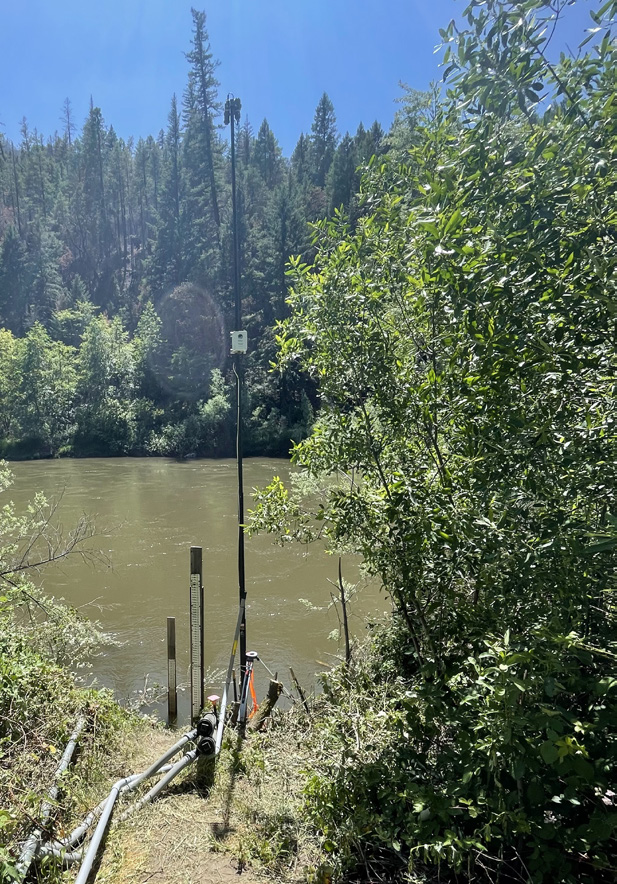
Remote terrain, limited access

Monitoring 408 km of river requires a dense sampling network, which is hard to operate in remote, rugged terrain. On-the-ground sensor installations help capture transient events that pass between stations, but only really help when operated in conjunction with remotely sensed observations.

Recovery requires a pre-removal baseline

Demonstrating that dam removal improved the river requires knowing what "before" looked like — not just from sensors installed for the project, but from the full historical satellite record going back years.

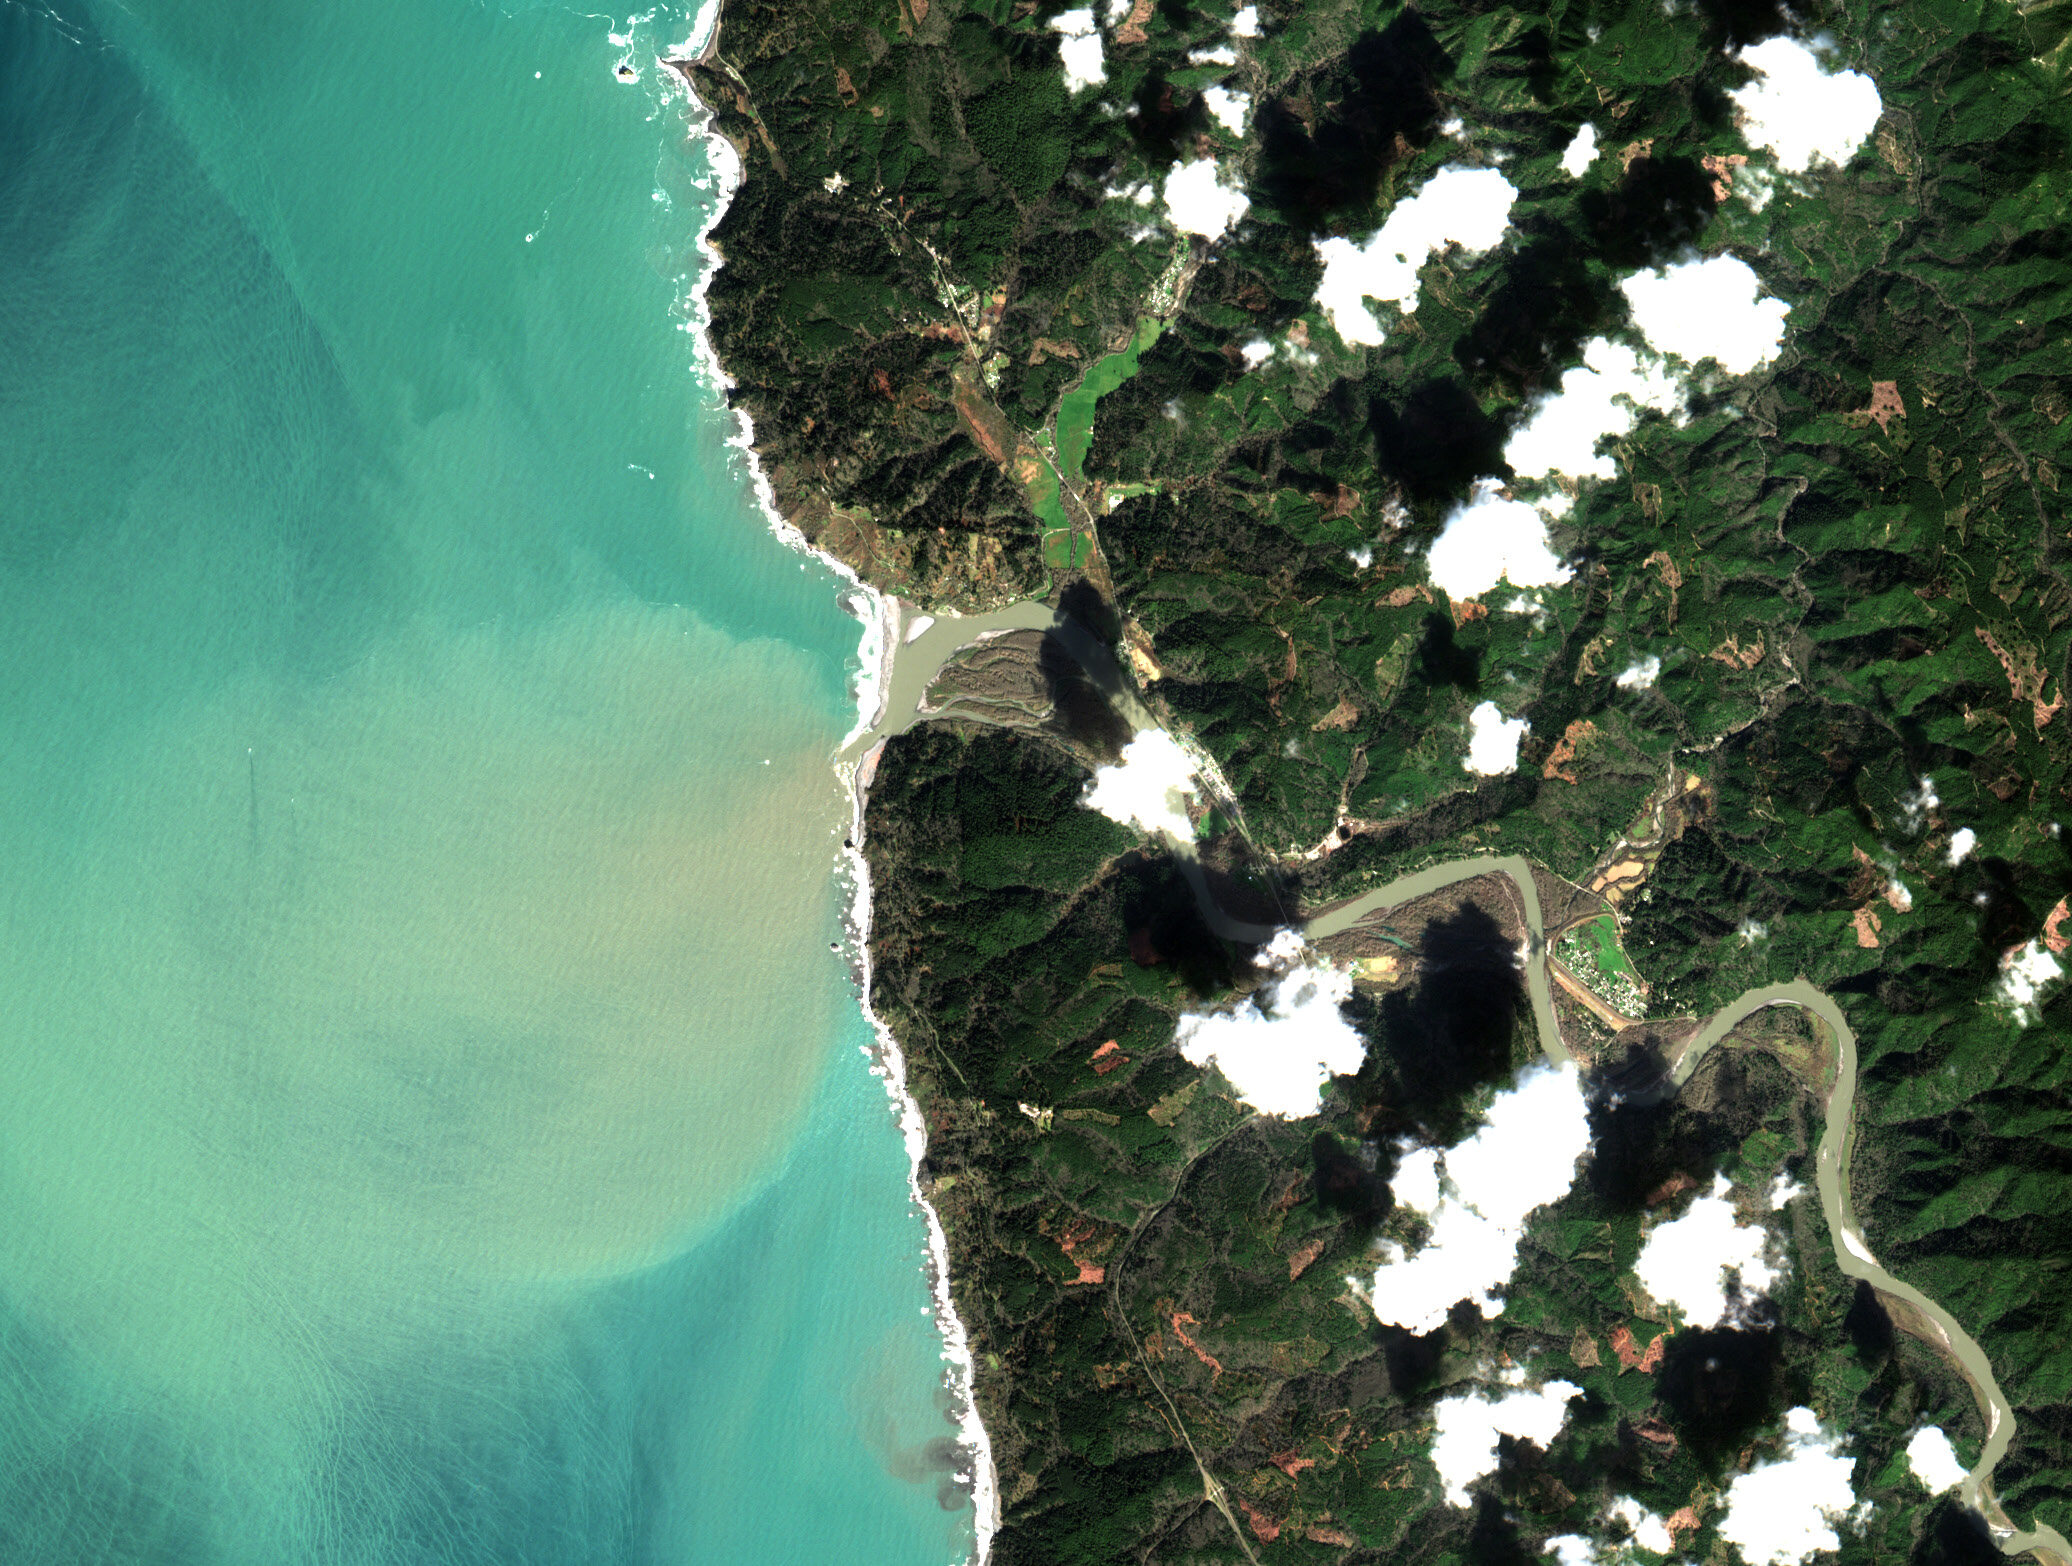
Continuous coverage, not snapshots

The most consequential events — a major sediment flush, an algal bloom, a tributary input — are brief and spatially localized. Catching them required continuous monitoring across the entire basin at both high temporal and spatial resolution, something no ground-based sensor network could provide alone.

Only a combination of continuous in-situ sensors and satellite coverage of the entire basin could capture events as they happened and place them in historical context.
Hyperspectral sensor installed at Walker Bridge on the Klamath River, with solar panel and mounting pole beside the river
Our Solution

A monitoring system combining on-the-ground sensors and satellites.

Monitoring commenced in October 2022 — before drawdown began — ensuring no part of the removal event would be missed and establishing a pre-removal baseline. Four hyperspectral sensors were installed at key locations along the river, co-located with USGS and Karuk Tribe gauging stations, providing continuous ground-truth data.

Sentinel-2 satellite data provided full basin coverage every five days, with a historical archive extending back to 2016. In July 2023, daily Planet Labs imagery was added — increasing spatial resolution from 10 m to 3 m and enabling monitoring of narrow tributaries and the estuary. Sensor and satellite data streams were fused continuously, producing water quality maps updated within 24 hours of each satellite overpass.

Three layers of coverage.

Sentinel-2 before and after imagery of J.C. Boyle Reservoir — green reservoir water on left, exposed sediment and dry riverbed on right after dam removal
Layer 1

Pre-removal historical baseline

The Sentinel-2 archive from 2016 onward was processed before any dam was touched — establishing eight years of seasonal variability in turbidity and chlorophyll-a against which post-removal changes could be measured.

Hyperspectral sensor and monitoring equipment installed at Iron Gate on the Klamath River — sensor pole, solar panel, and data logger beside the river
Layer 2

Real-time sensor + satellite fusion

Four hyperspectral sensors delivered continuous near-real-time readings at critical points along the river. This ground-truth data was fused with satellite imagery to produce calibrated water quality maps across the entire basin — automatically, without manual intervention.

Sentinel-2 satellite image of the Klamath River mouth at the Pacific Ocean — sediment-laden river water visible as a brown plume dispersing into turquoise ocean
Layer 3

Basin to ocean coverage

Monitoring extended beyond the river mouth into the Pacific Ocean, tracking sediment plumes as they entered coastal waters and dispersed in ocean currents — presenting a complete picture of the sediment budget from source to sea.

Results

The river is recovering — and we can see it.

Sediment slugs released by the dam breaches were detected at their source and tracked downstream station by station — showing a 4× reduction in peak turbidity over the travel distance to the ocean (see sediment tracking example just below). By 2025, turbidity had returned to pre-removal baselines and extreme slugs were no longer detected.

The historical satellite archive revealed a second story: algal blooms in the former reservoir areas had been intensifying for eight years. Post-drawdown, blooms collapsed. Chlorophyll-a dropped sharply in all three former reservoir zones, and the summer 2024 bloom — an annual feature for years — did not materialize due to restored free-flowing river conditions.

Before-and-after satellite imagery makes the transformation visible to anyone: standing reservoir water replaced by a free-flowing river channel, sediment plumes propagating downstream and clearing within weeks.

1,400 FNU
Peak turbidity detected during removal
Tracked from Iron Gate to the Pacific · Baseline restored by 2025
8 years
Of algal bloom trend — reversed immediately
No summer bloom detected in 2024 · Confirmed across all former reservoir sites
Chlorophyll-a time series chart 2016–2024 showing algal blooms at former JC Boyle, Copco, and Iron Gate reservoirs — rising pre-drawdown trend with dashed line, bloom collapse visible after dam removal in 2024
Hyperspectral sensor installed at Requa on the lower Klamath River — sensor pole beside murky brown river water in dense forest
Sensor at Requa One of four hyperspectral sensors installed along the river, co-located with USGS gauging stations
Sentinel-2 satellite view of the Klamath River mouth — brown sediment plume from the river meeting turquoise Pacific Ocean water, May 2025
Klamath Mouth, May 2025 Satellite image showing sediment transported from the former dam sites entering and dispersing in Pacific Ocean currents
Hyperspectral sensor and monitoring equipment installed at Iron Gate on the Klamath River — sensor pole, solar panel, and data logger beside the river
Sensor at Iron Gate One of four hyperspectral sensors installed at critical points along the river, co-located with USGS gauging stations
Sediment Tracking

A sediment slug tracked from source to sea.

In late February 2025, a major sediment flush originating at the former Iron Gate Reservoir was tracked continuously as it traveled 300 km downstream to the Pacific Ocean. Each sensor station recorded the slug's arrival and dissipation — revealing a 4× reduction in peak turbidity over the journey. By 2025, slugs of this intensity were no longer detected, marking the river's return to pre-removal conditions.

Time series chart showing turbidity in FNU at five stations — Irongate, Walker Bridge, Seiad Valley, Orleans, and Turwar — February 27 to March 6 2025. Successive peaks show the sediment slug arriving and dissipating as it travels downstream.

In situ turbidity measurements at five stations along the Klamath, Feb 27 – Mar 6 2025. The sediment slug peaked at 860 FNU at Iron Gate and dissipated to ~200 FNU by the time it reached Turwar at the river mouth.

What the River Looks Like

Five distinct water types — all in the same river.

The Klamath's water changes dramatically with the seasons and events: snowmelt produces turquoise clarity, organic flushes turn the water dark, storm runoff brings red-brown sediment loads. Each water type has a distinct optical signature visible from space — and each requires a different interpretation to measure accurately. These satellite snapshots show the Klamath mouth across five different conditions observed during the monitoring period.

Five satellite snapshots of the Klamath River mouth showing distinct water types: sandy low-flow, dark organic, clear turquoise snowmelt, red-brown storm runoff, and milky sediment-laden water.

Satellite imagery of the Klamath estuary across five observed water types. Accurately comparing these conditions requires detecting which water type is present before applying water quality algorithms.

"Dam removal is the best way to bring a river back to life. The Klamath is significant not only because it is the biggest dam removal and river restoration effort in history, but because it shows that we can right historic wrongs and make big, bold dreams a reality for our rivers and communities."

Dr. Ann Willis — California Director, American Rivers

Let's get to work

This could be your river!

The technology and expertise behind the Klamath project — satellite + sensor fusion, continuous automated processing, spatial water quality maps — is now available through Aqualytics. We work with restoration organizations, NGOs, government agencies, and water utilities to monitor rivers, lakes, and estuaries worldwide.

Find out how our solutions can work for you.

Whether you're monitoring a single restoration site or an entire watershed, we can help.

Get in touch
Salmon leaping through white water rapids on the Klamath River — the return of native fish following dam removal