Case Study
Mississippi River — Nutrient Monitoring
Scaling nutrient monitoring from a handful of gauge stations to basin-wide, continuous coverage along 200 km of the lower Mississippi and Atchafalaya rivers.
Scaling nutrient monitoring from a handful of gauge stations to basin-wide, continuous coverage along 200 km of the lower Mississippi and Atchafalaya rivers.
The Nature Conservancy's Louisiana Chapter is working to reduce nitrates in the Mississippi River by improving the sustainability of agricultural practices and enhancing the ecosystem's natural filtration capacity. Their goal: track the ecological impact of dozens of conservation projects across the basin — cumulatively, not just locally.
Through a combination of science, policy, and on-the-ground restoration, TNC has activated 17 business units, over 100 staff members, and over $2 million annually into a cohesive coalition working with agricultural producers, suppliers, and landowners to grow more food with less fertilizer and restore floodplain wetlands — the river's natural kidneys.
The challenge: none of this effort could be measured at the scale it was happening. TNC needed a way to see the whole river, not just isolated points.
A fundamental shift from local to basin-scale monitoring.
Pollution in the Mississippi is a large-scale problem. It accumulates downstream, crosses state lines, and culminates in a large and growing dead zone in the Gulf of Mexico. But monitoring has always been local.
USGS gauges cost $100k per year per site and require ongoing maintenance. Even so, continuous long-term nitrate monitoring is available at only about 10–15 locations across the entire basin — a river system draining 40% of the continental United States.
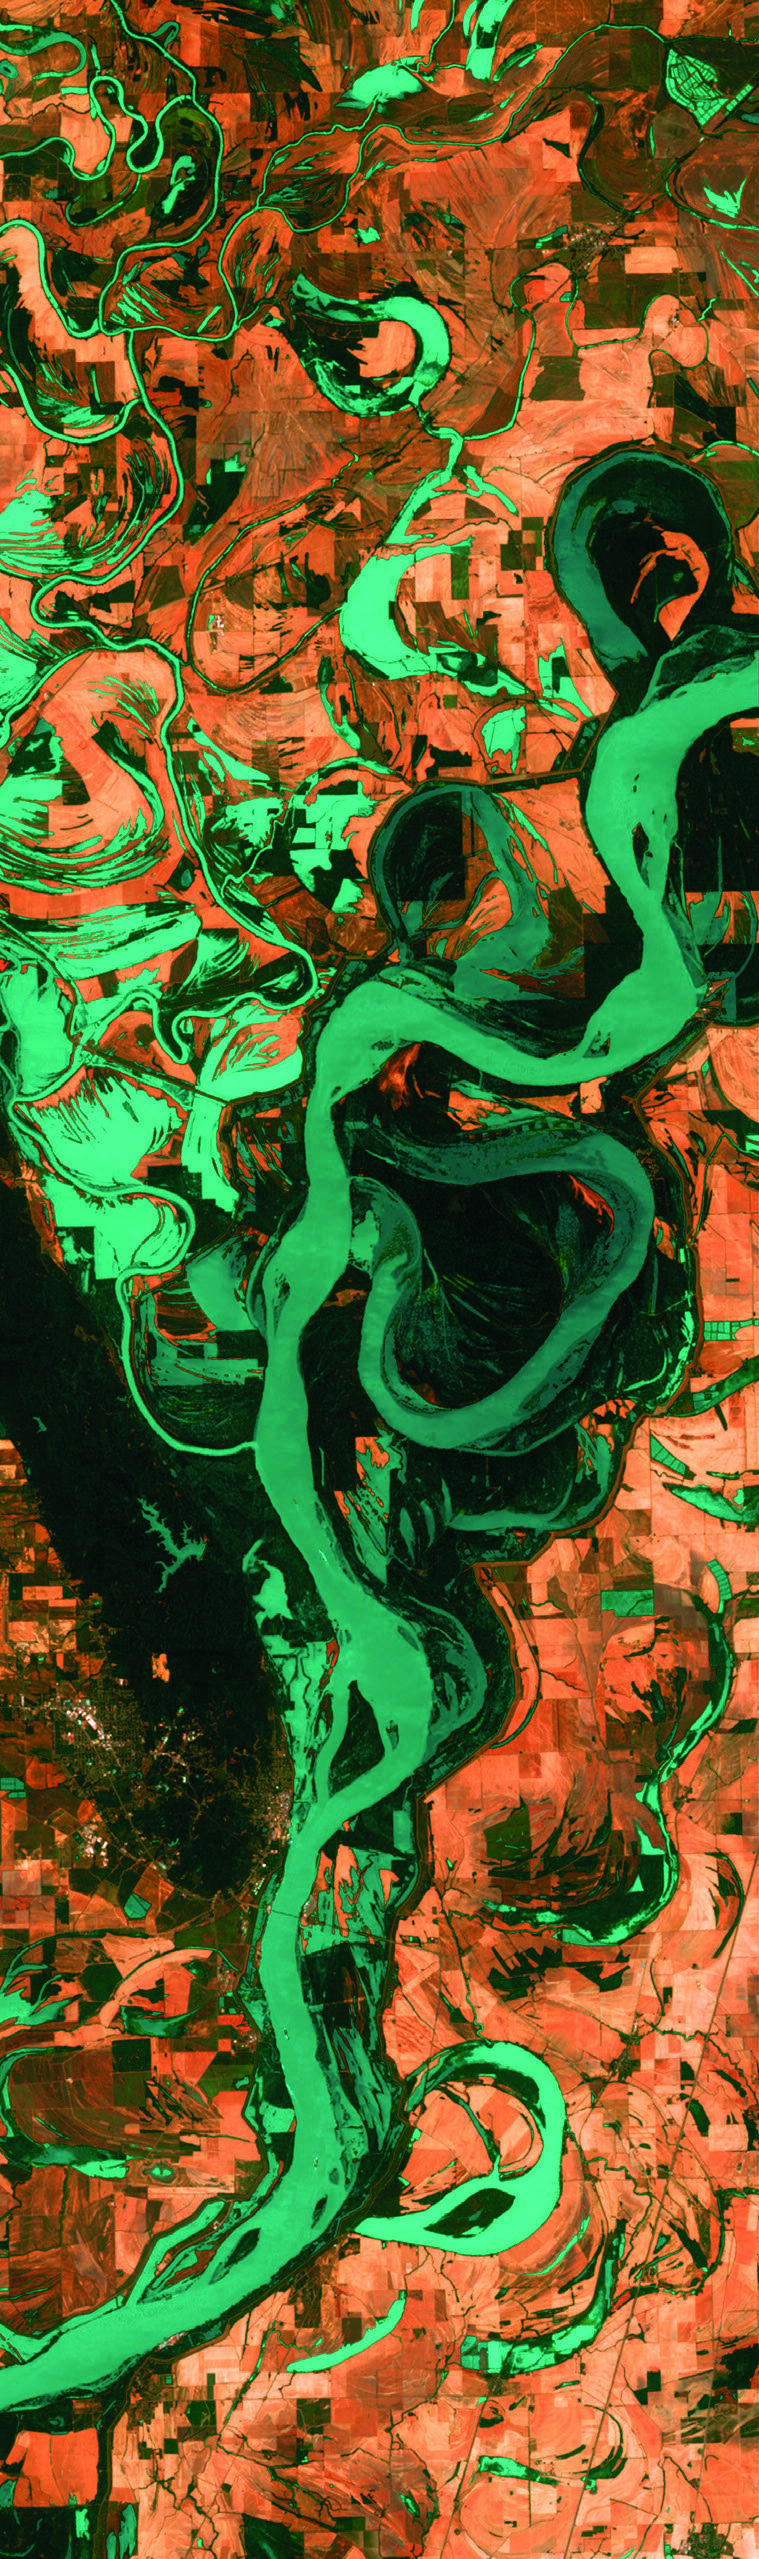
Water quality can be vastly different from one stretch of river to the next. Spatial patterns — the ones that reveal where pollution originates and where it dissipates — are invisible to a sparse network of sondes.
TNC needed to shift from measuring progress at individual project sites to measuring it at the basin scale. That requires a comprehensive baseline: understanding the natural variation in water quality across hundreds of kilometers, so that real changes can be detected against it.
The goal was not more data points — it was coverage. The ability to see nutrient dynamics as a spatial whole, across confluences, floodplains, and agricultural drainage areas simultaneously.
Additionally, TNC needed to monitor remotely at specific floodplain restoration sites — reducing project costs and enabling access to areas that would otherwise be impractical to reach.
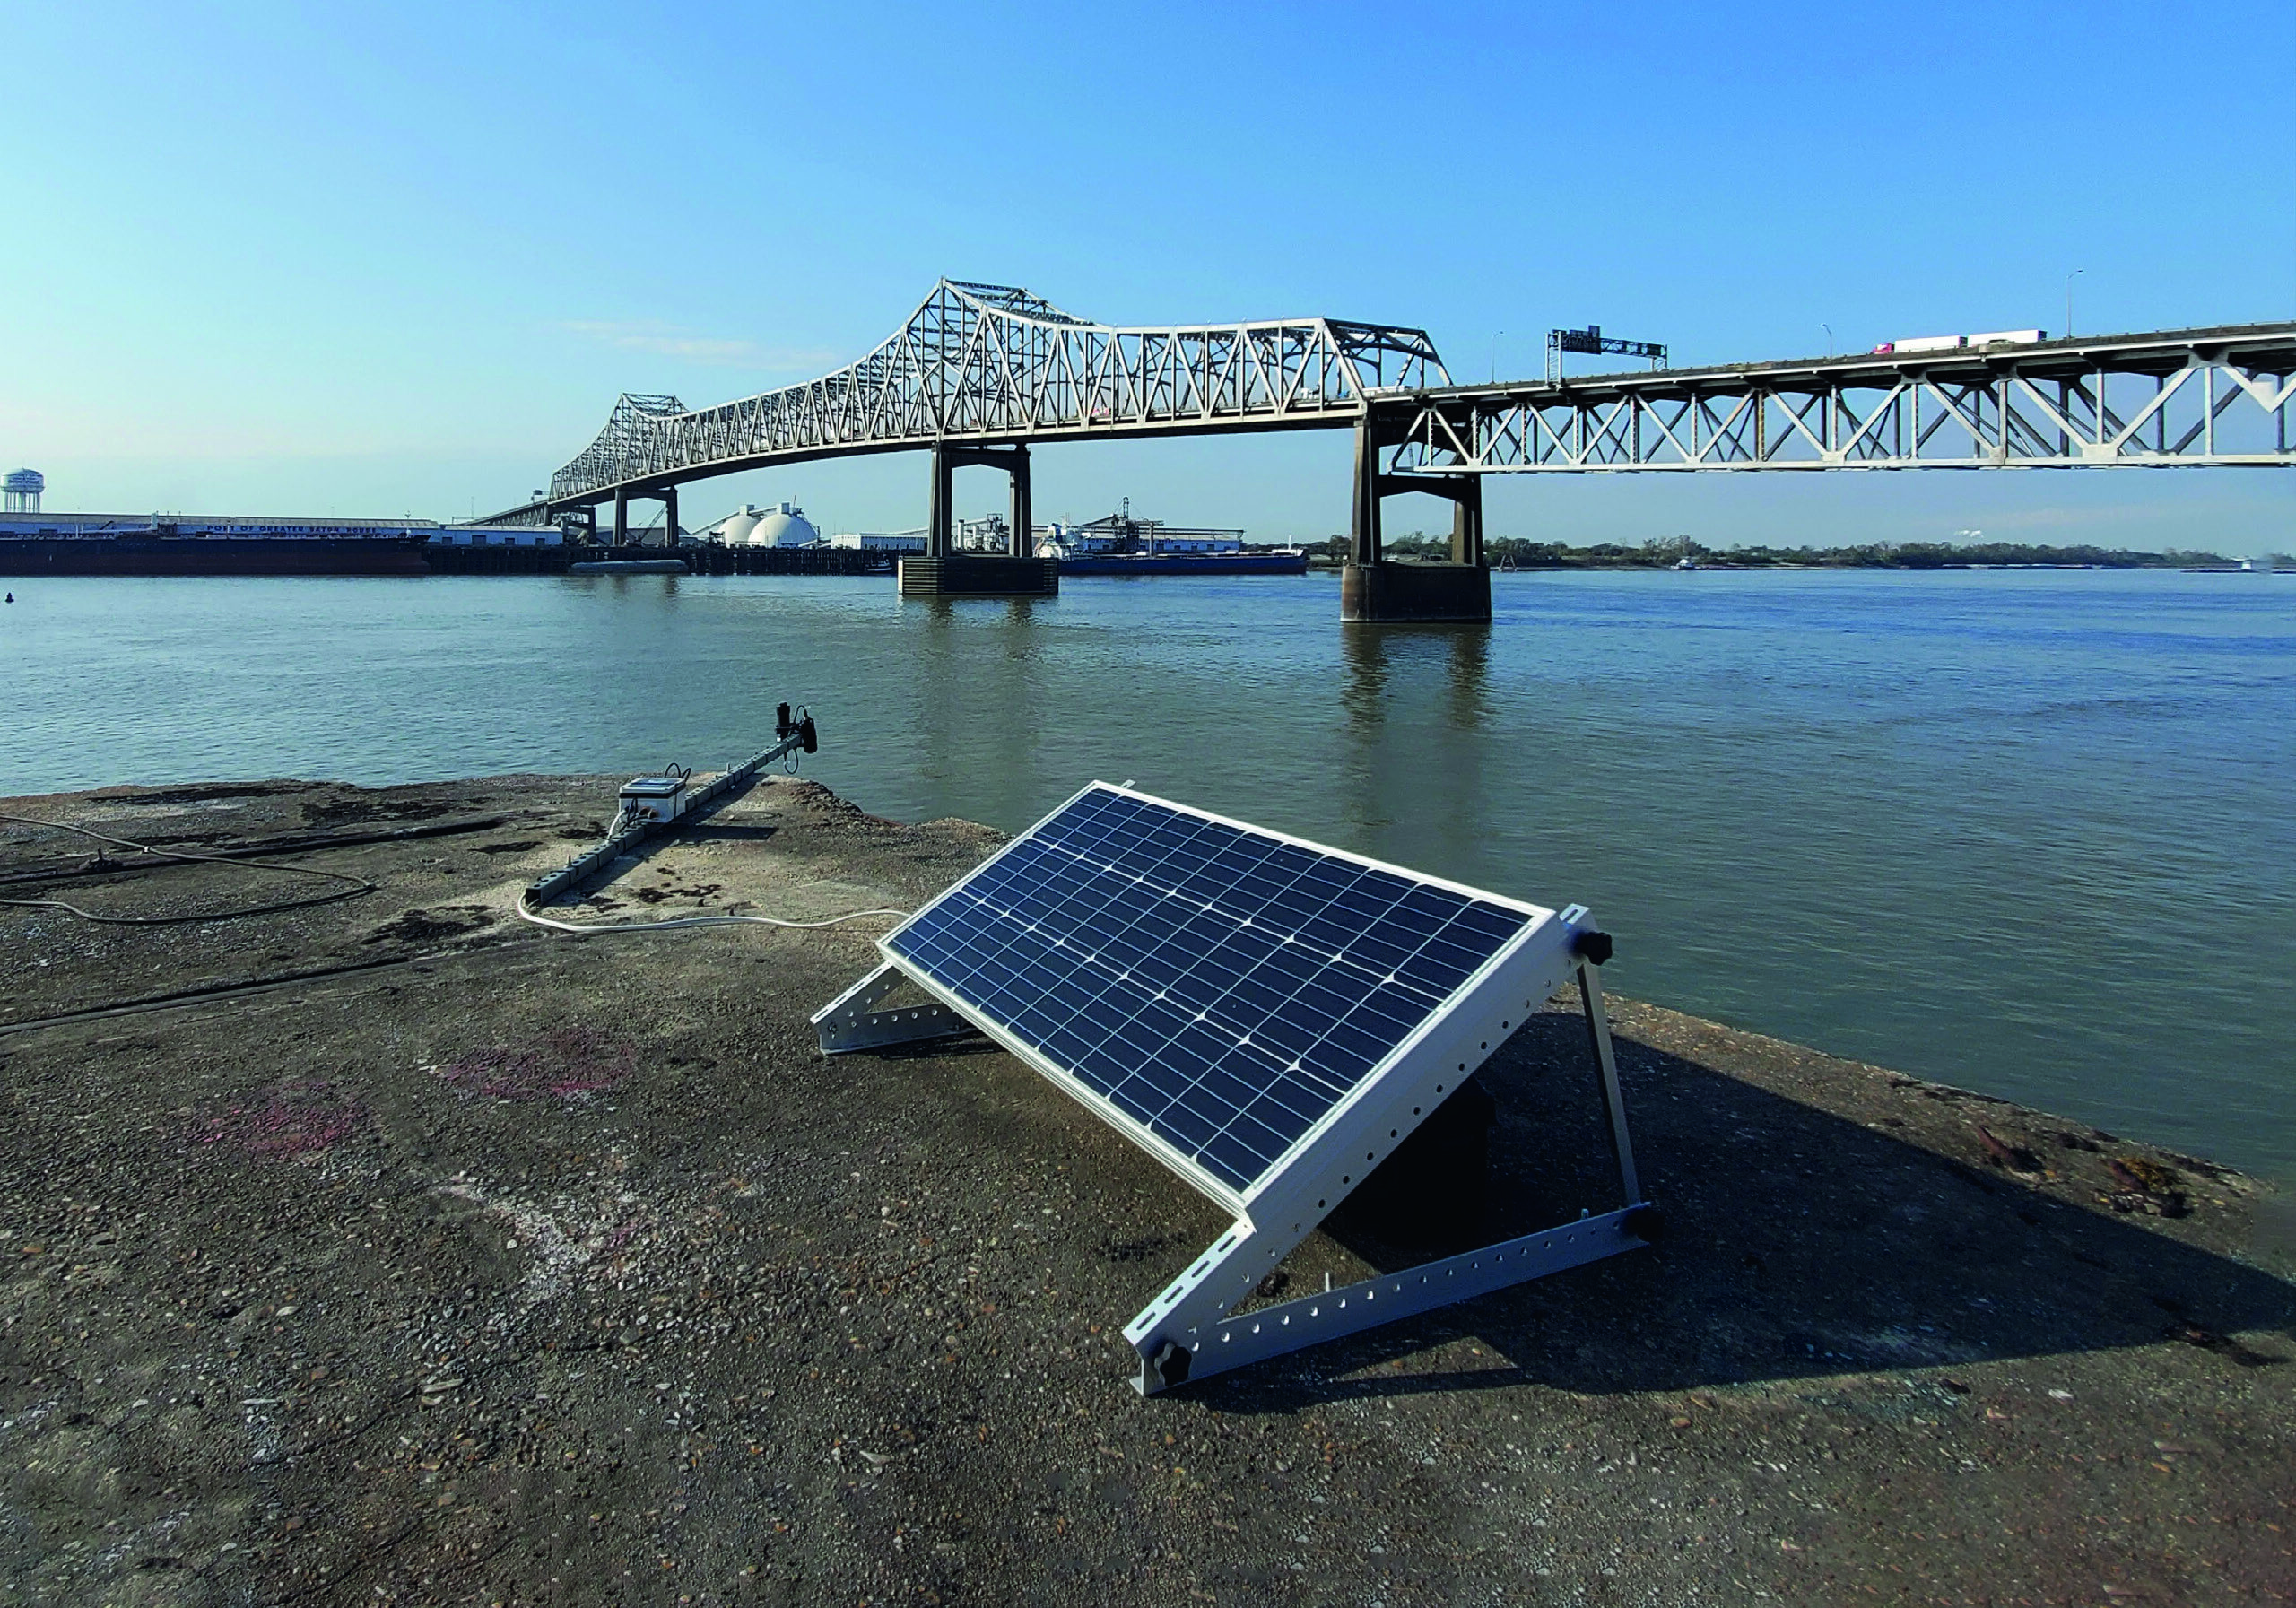
In August 2019, Gybe and TNC began working together in the lower Mississippi. In about one day, two sensors were installed — one at the Water Institute of the Gulf on the Mississippi River, and one on the Atchafalaya River.
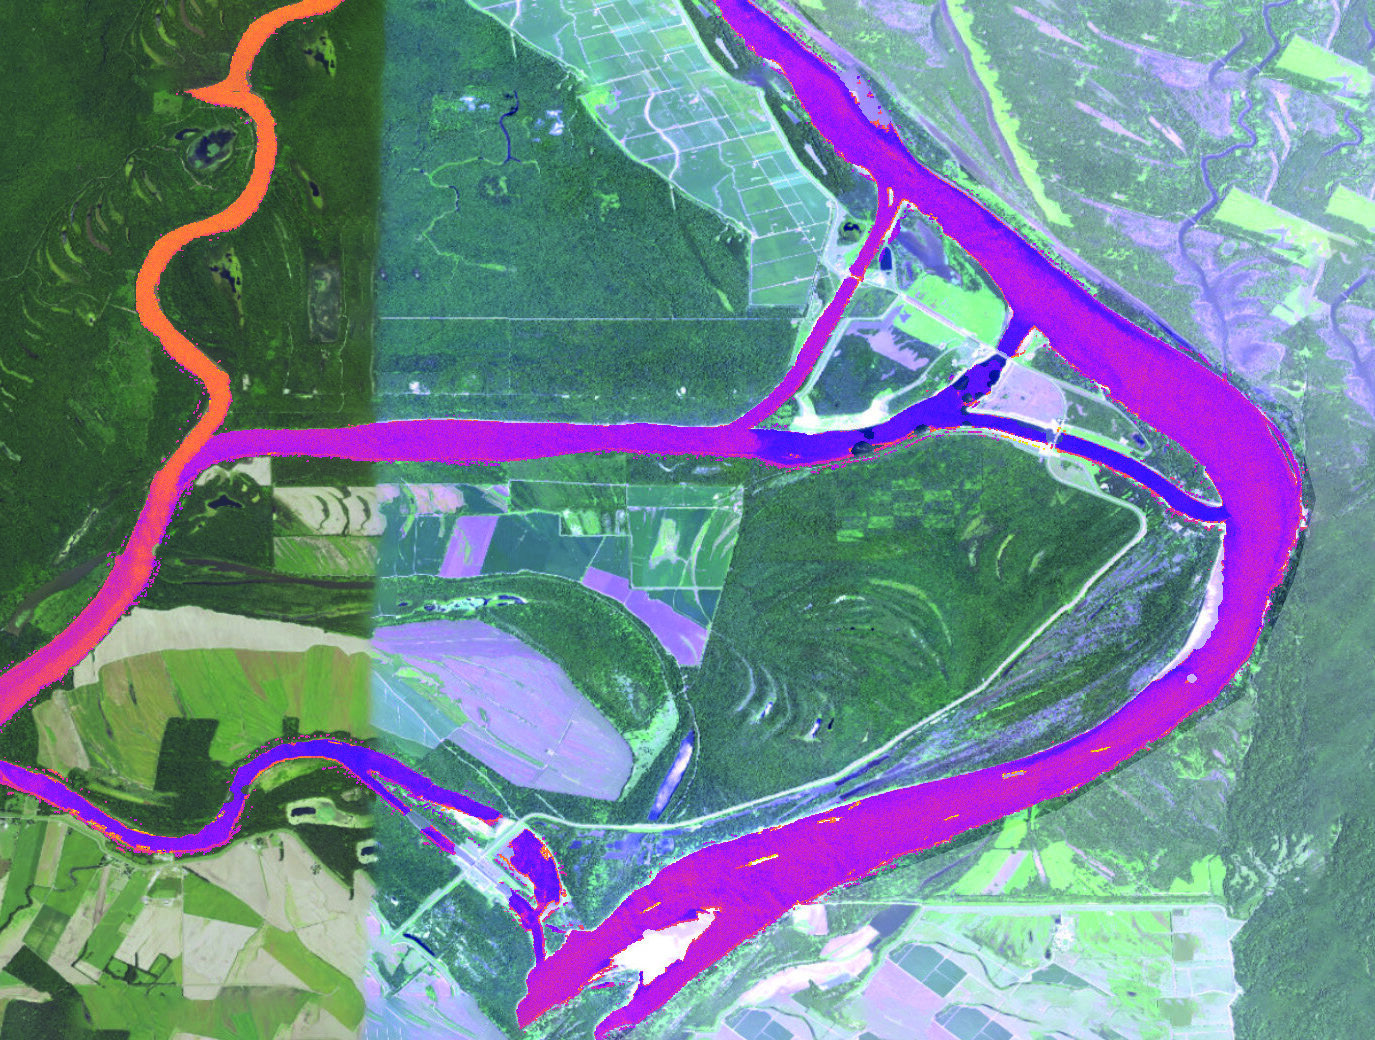
Nitrate models were then built using a combination of satellite imagery and in-situ sensor data, calibrated against USGS reference measurements. The resulting maps are automatically updated via our web platform — no software installation, no manual data pulls.
Results show excellent predictability of nitrate levels across a broad range of variation in discharge, pigment, and sediment conditions, for this specific part of the Mississippi.
USGS stations cost $100k per year per site. YSI sondes run $10k–$50k each — and that represents only 2–12% of total monitoring costs, according to EPA estimates. The majority of the cost is in manual labor: deploying, maintaining, and analyzing sonde data.
With Aqualytics (initially Gybe), TNC gets coverage of hundreds of kilometers of river from two installations. Even deploying sondes at every 10-km interval, that level of spatial coverage would be physically and financially out of reach.
Aqualytics (initially Gybe) provides TNC with orders of magnitude more data, helping them more completely understand water dynamics across the Atchafalaya and lower Mississippi — and the ecological impact of their conservation work. That understanding can then be communicated clearly to donors, partners, and policymakers.
We now have the potential to get never before seen insight about nutrient distributions across a watershed, and begin to accurately assess the impact conservation efforts are having to improve water quality.
By providing an order of magnitude more spatial information than point sensors, Aqualytics enables TNC to automatically track what is happening across the entire surface of the water body — every 5 days, continuously.
Aqualytics visualises and analyses data in a no-install web platform, enabling the discovery of new patterns and easier communication — internally, with partners, and with donors — about what the data means.
The fully automated system continuously updates data, so TNC spends more time on conservation work and less time maintaining equipment and processing raw readings. No lab, no manual sonde retrieval, no data backlog.